The Sales Pipeline
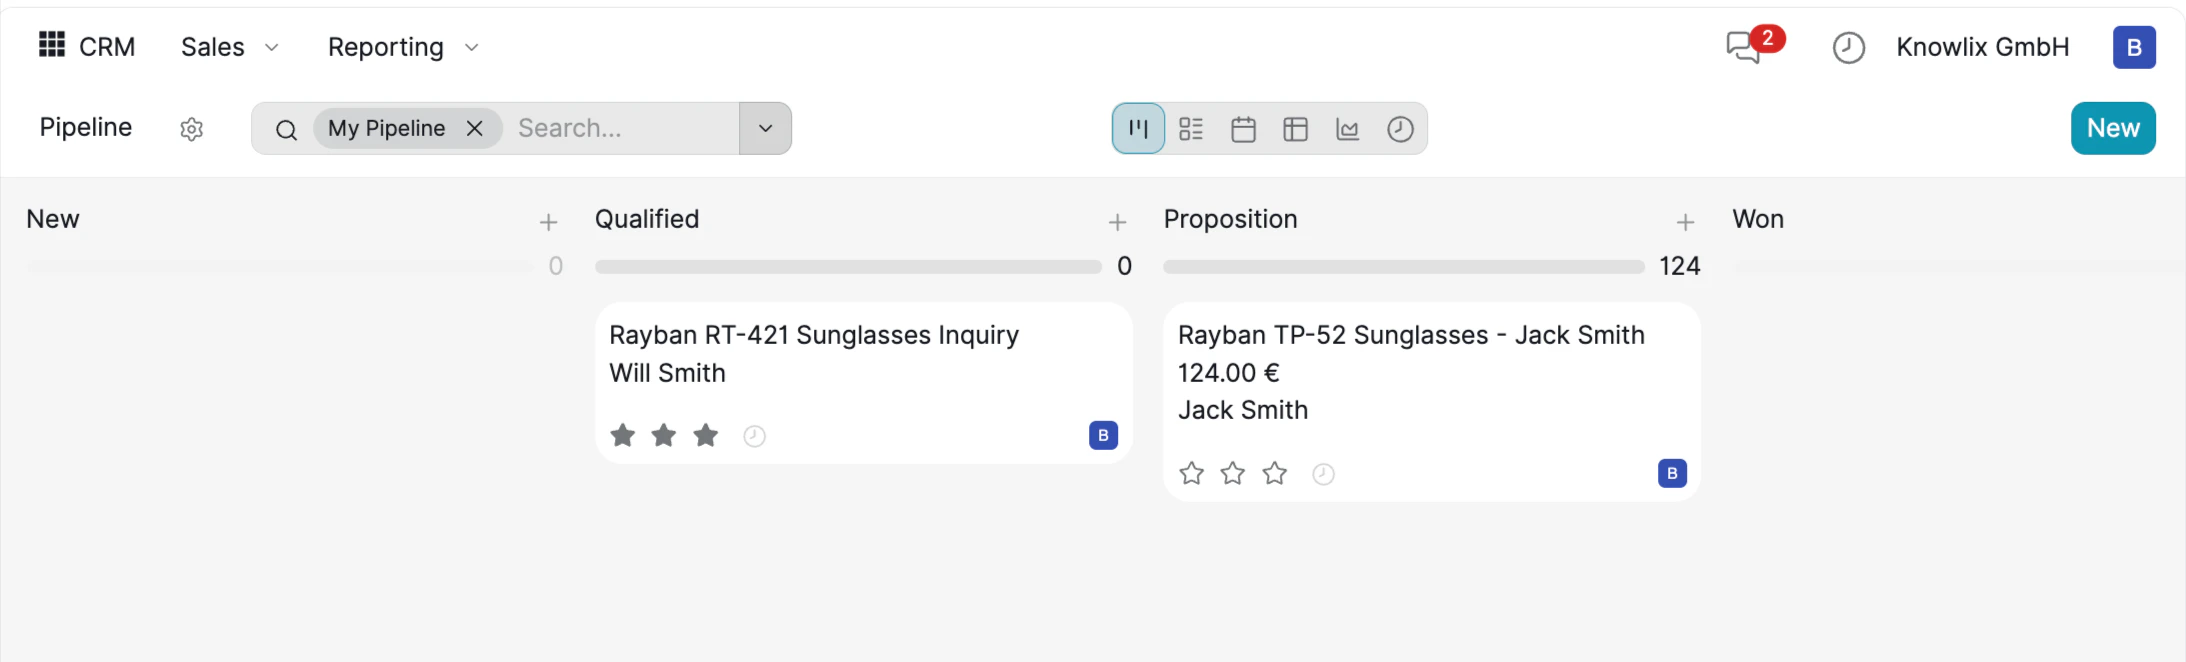
- Pipeline Cards: Click any card to open the full lead detail view.
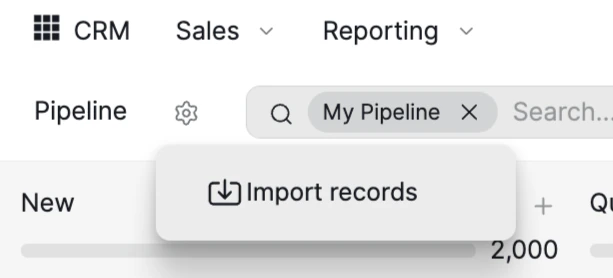
- My Pipeline Filter: Use the My Pipeline tag in the search bar to see only leads assigned to you.
- View Options: Switch between Kanban, List, Calendar, Pivot, Graph, and Activity views using the toolbar icons.
Creating Leads with AI
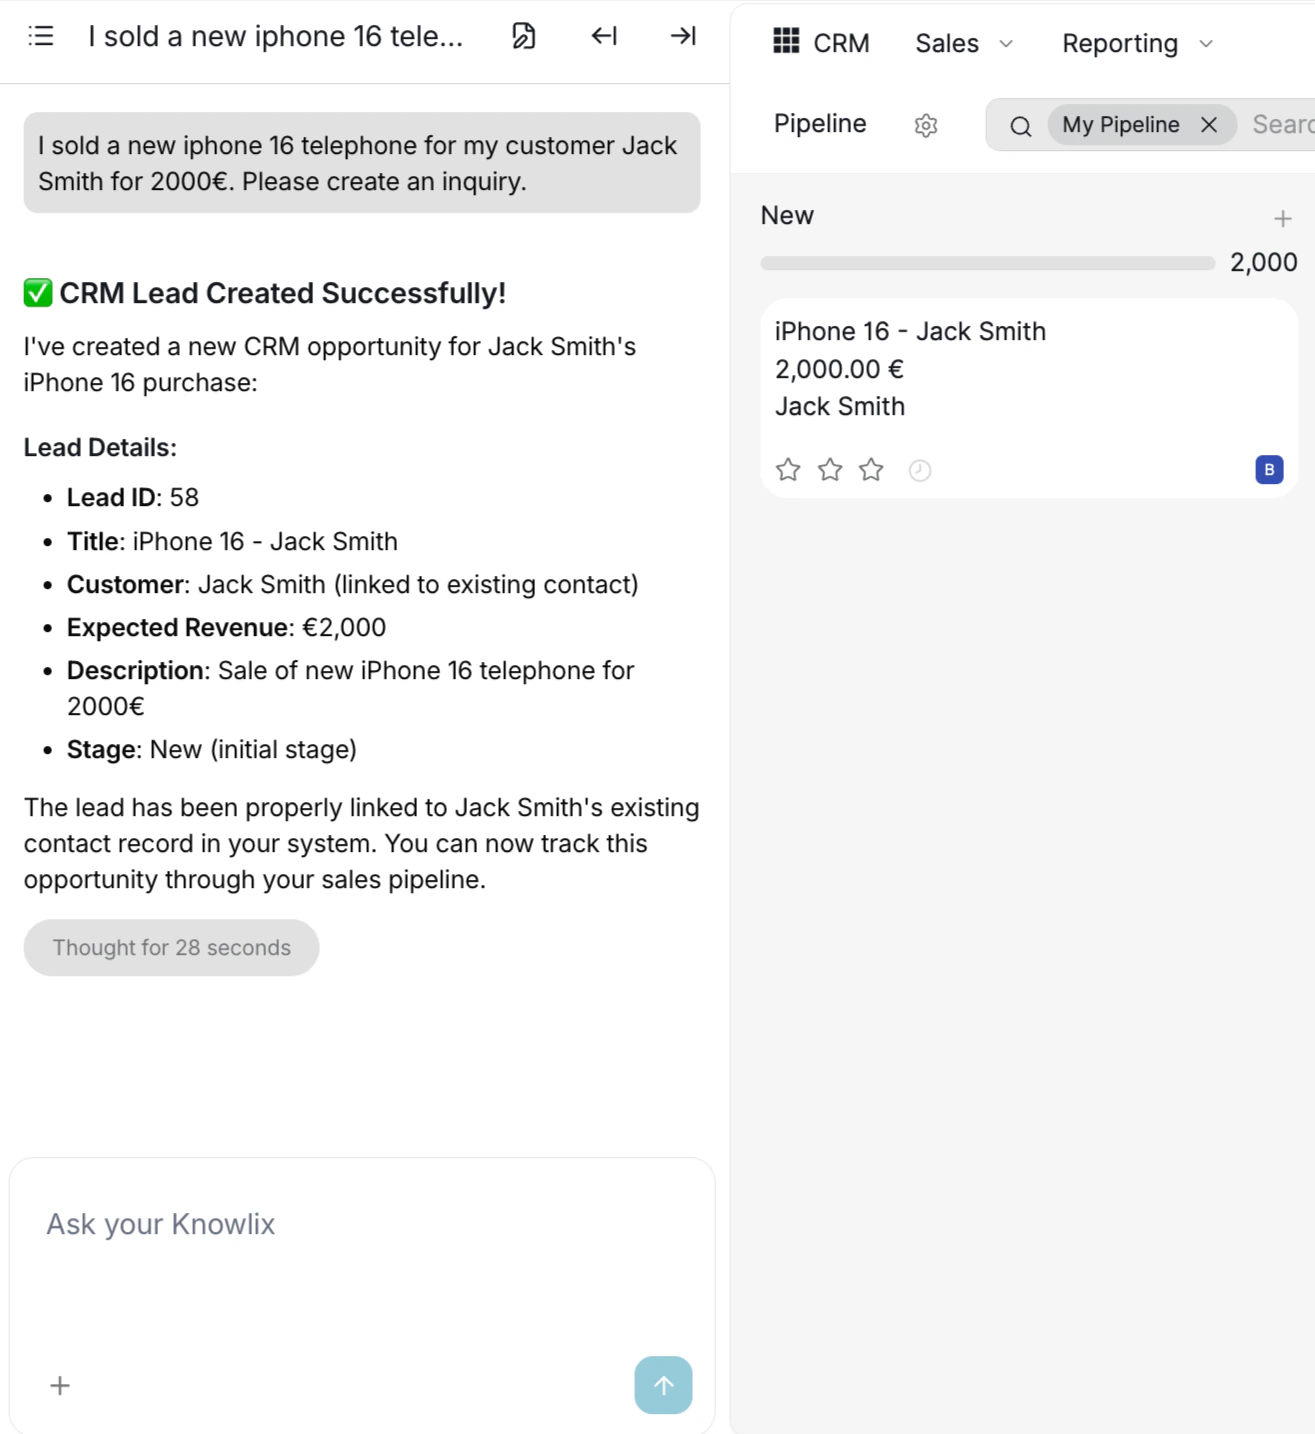
One of Knowlix’s most powerful features is the Ask your Knowlix AI assistant. Instead of filling out forms manually, describe what you need in natural language and the AI handles everything.Try typing: “I sold a new iPhone 16 telephone for my customer Jack Smith for 2000€. Please create an inquiry.”
AI Processing
The assistant analyzes your message, identifies the key entities, and creates all necessary records automatically.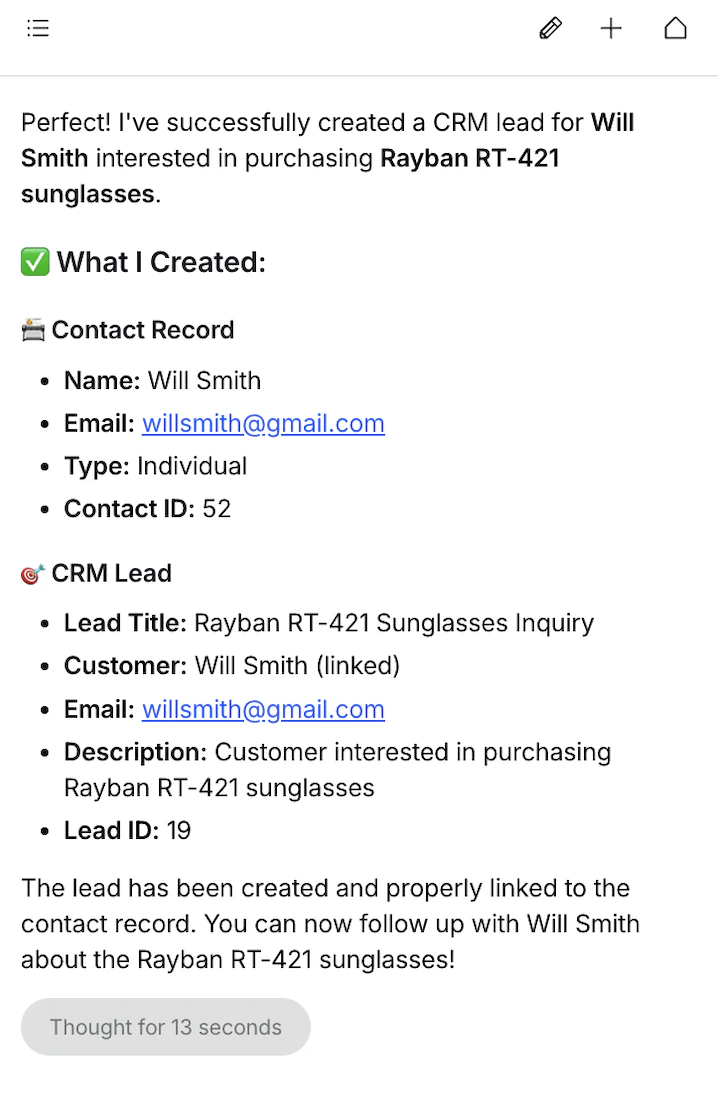
The AI identifies and creates:
- Contact Record: Name, email, type (Individual/Company), and a unique Contact ID.
- CRM Lead: Lead title, linked customer, product interest, description, and Lead ID.
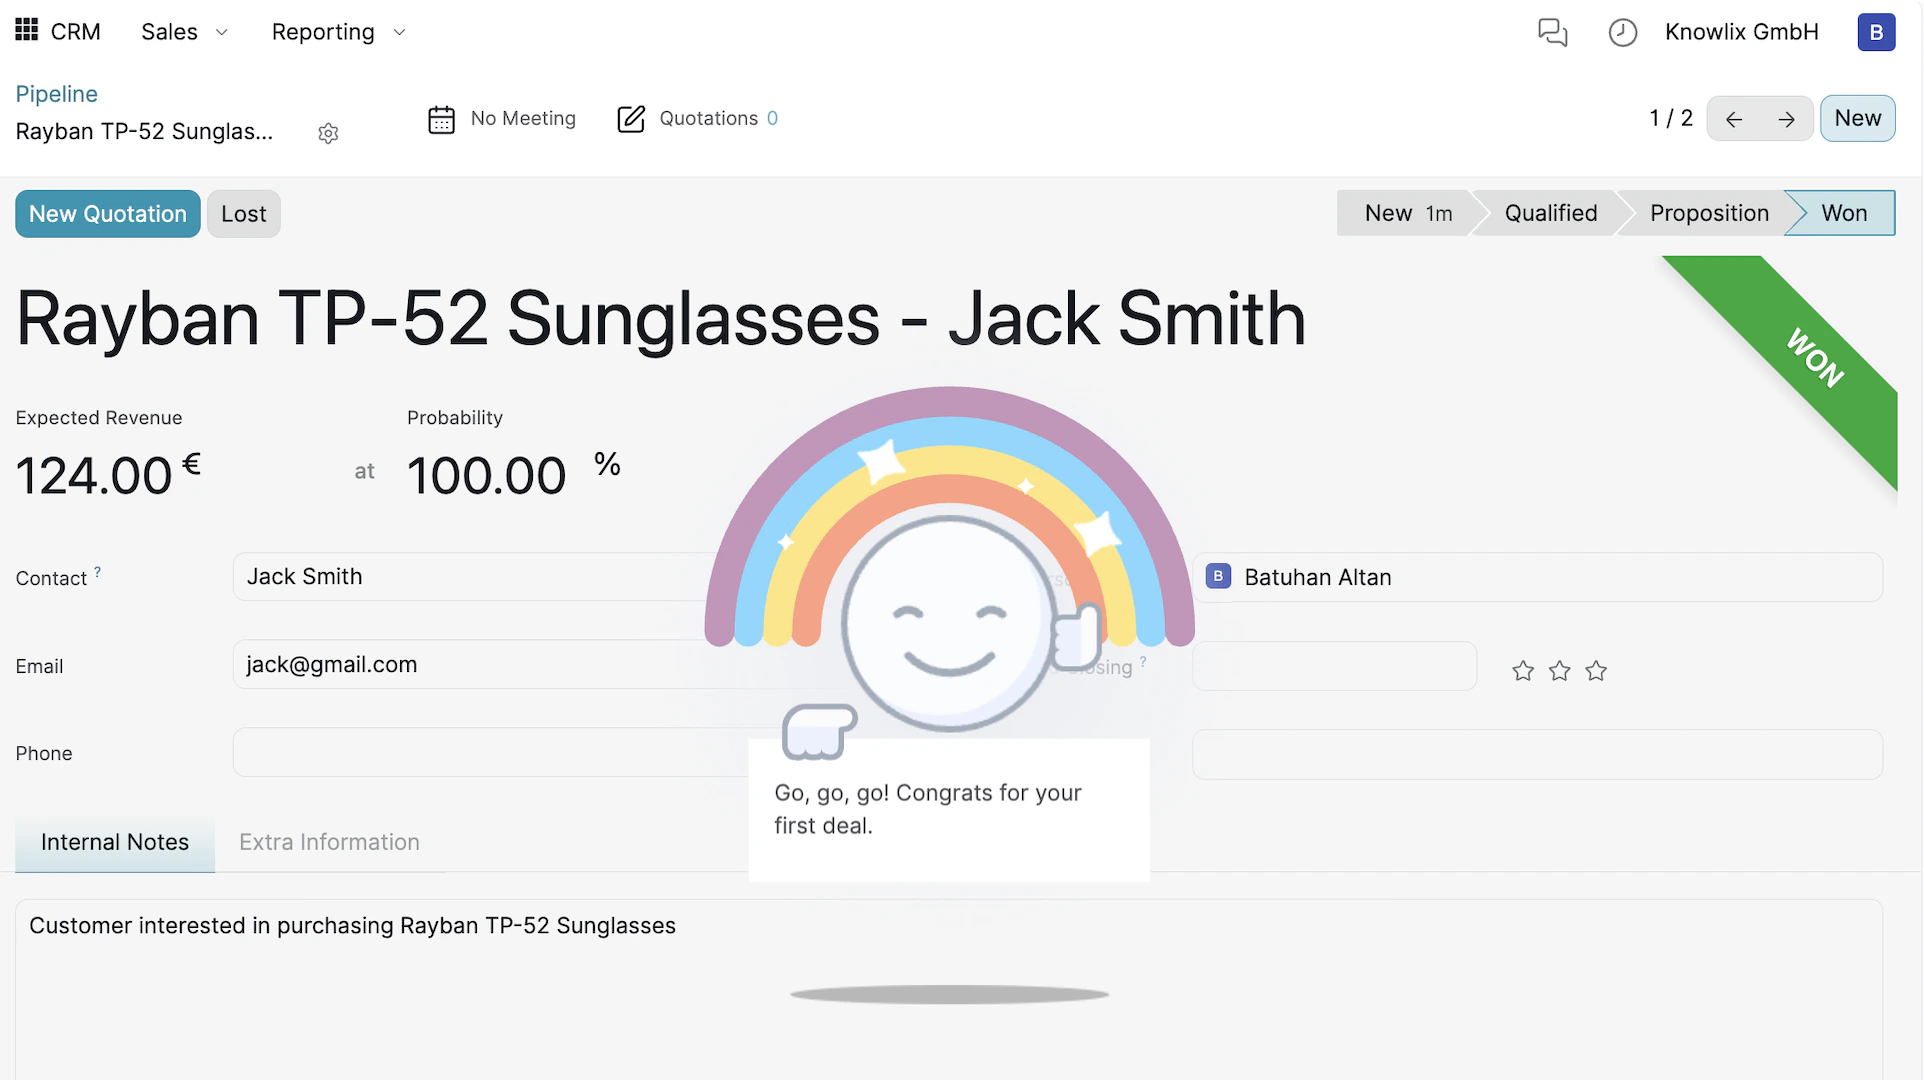
Lead Detail View
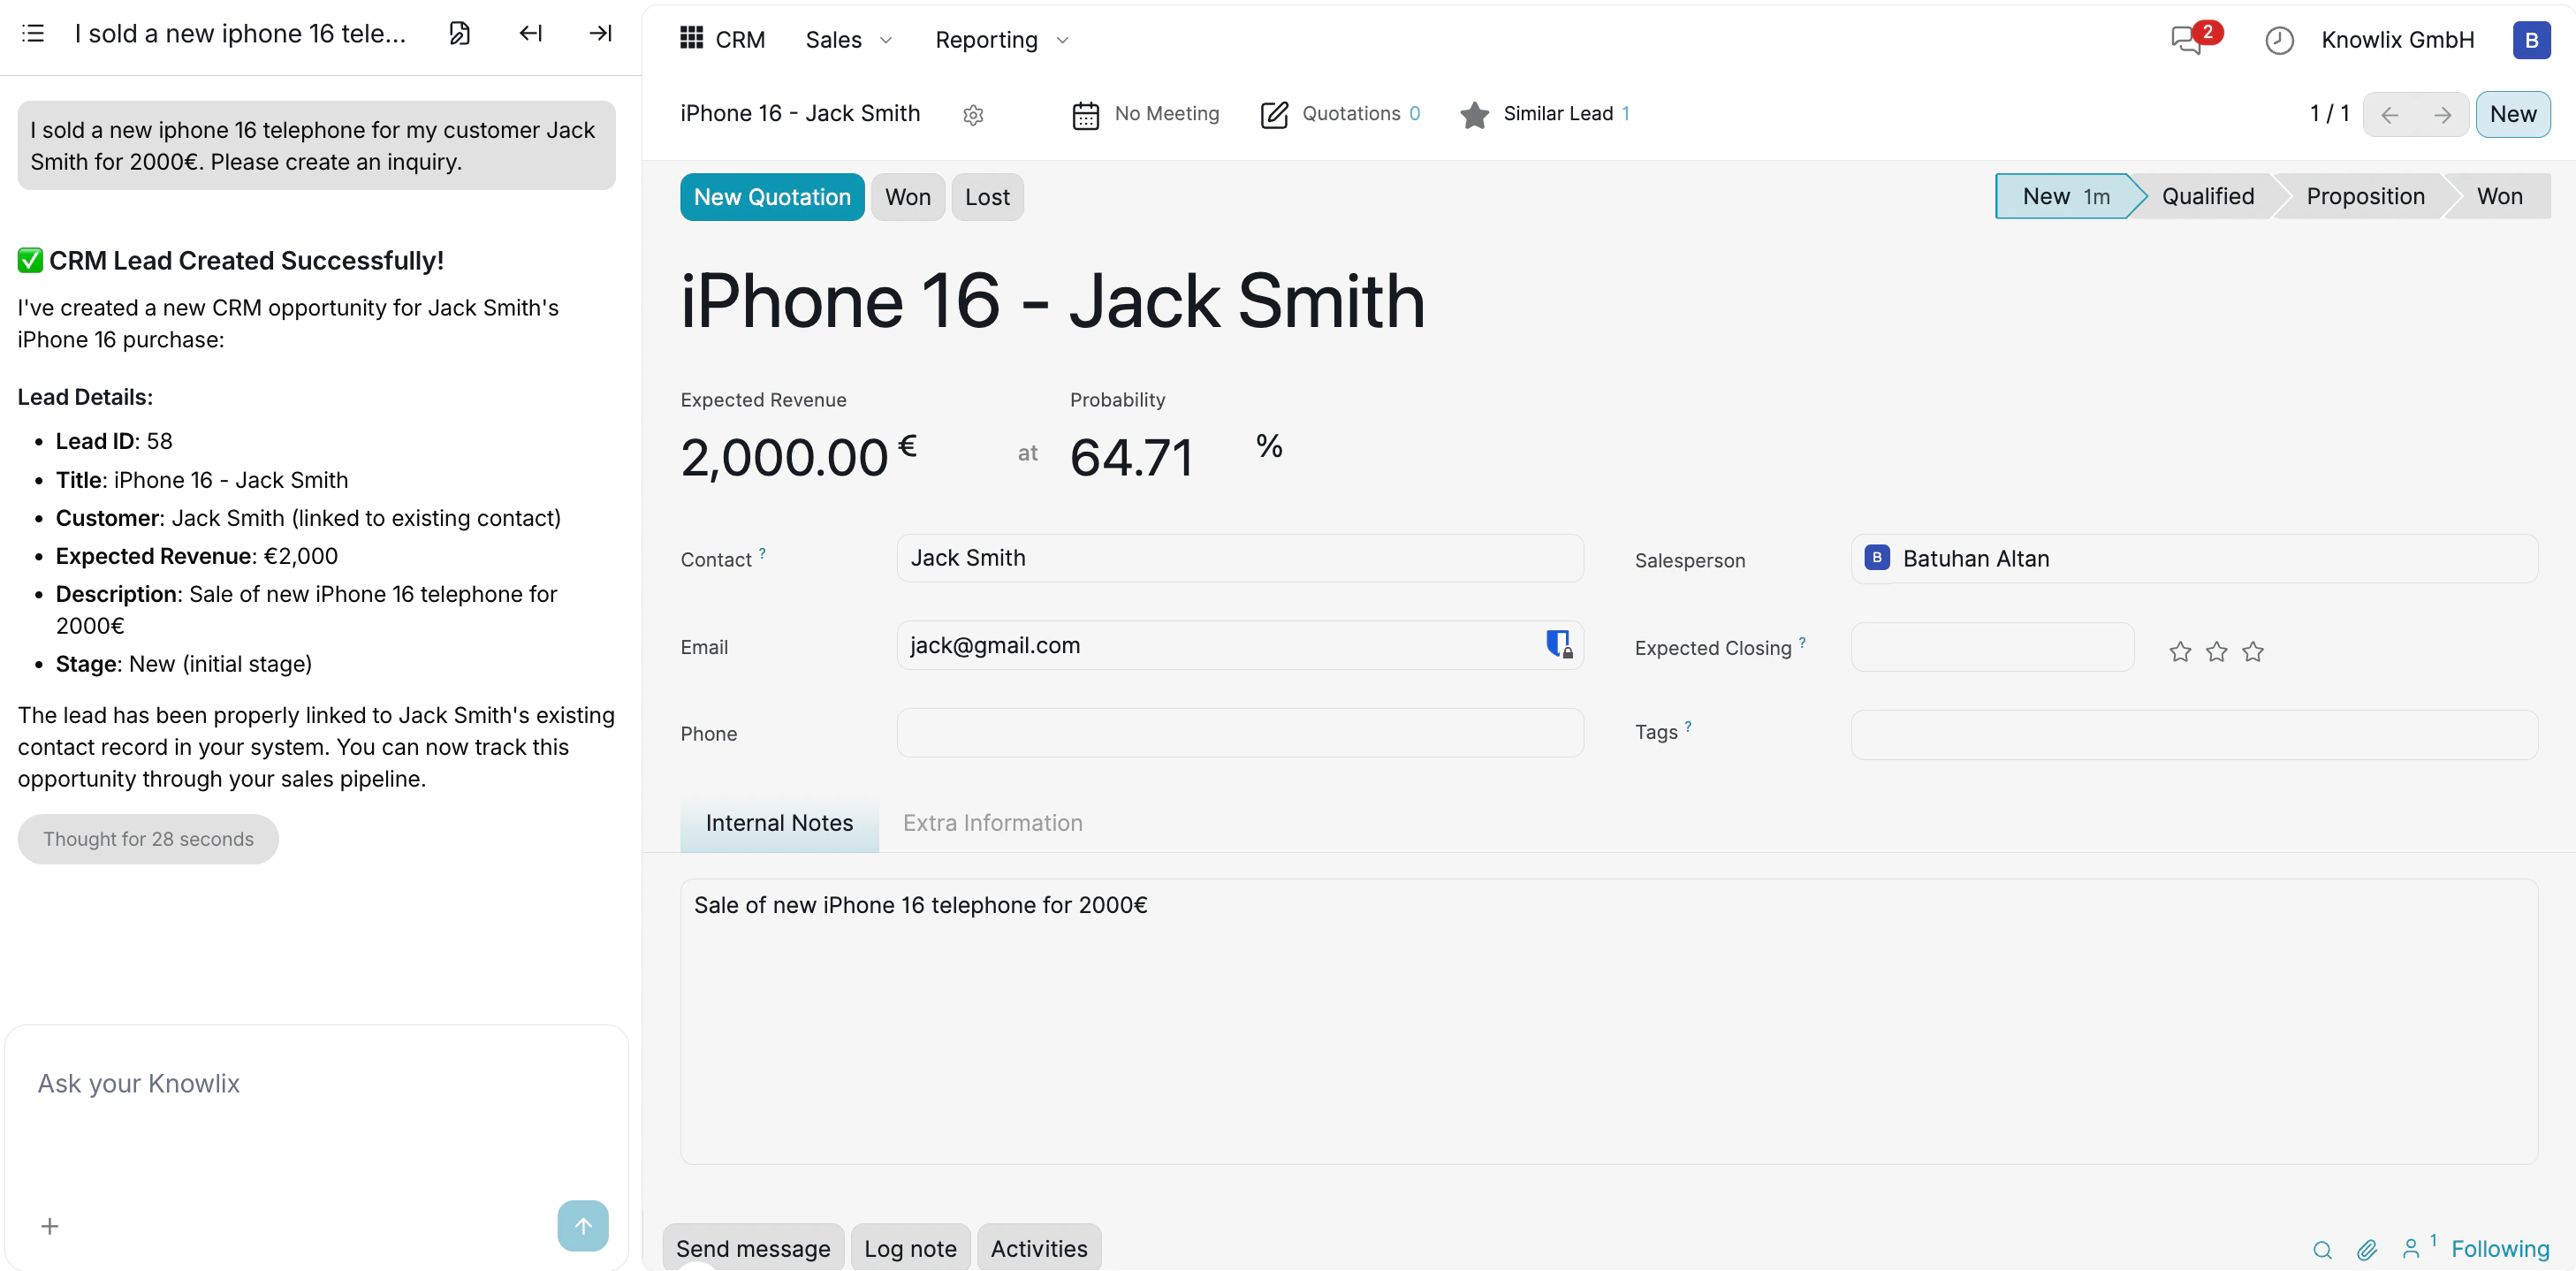
- Contact & Email: The linked customer and their contact details.
- Salesperson: Automatically assigned to you, editable if needed.
- Expected Closing: Set a target close date for pipeline forecasting.
- Stage Bar: The breadcrumb at the top right (New → Qualified → Proposition → Won) shows exactly where this deal stands.
- Internal Notes: The AI auto-fills a description based on your original message.
Progressing through the Pipeline
Track your deals visually by dragging cards between columns or using the stage bar within the lead detail view.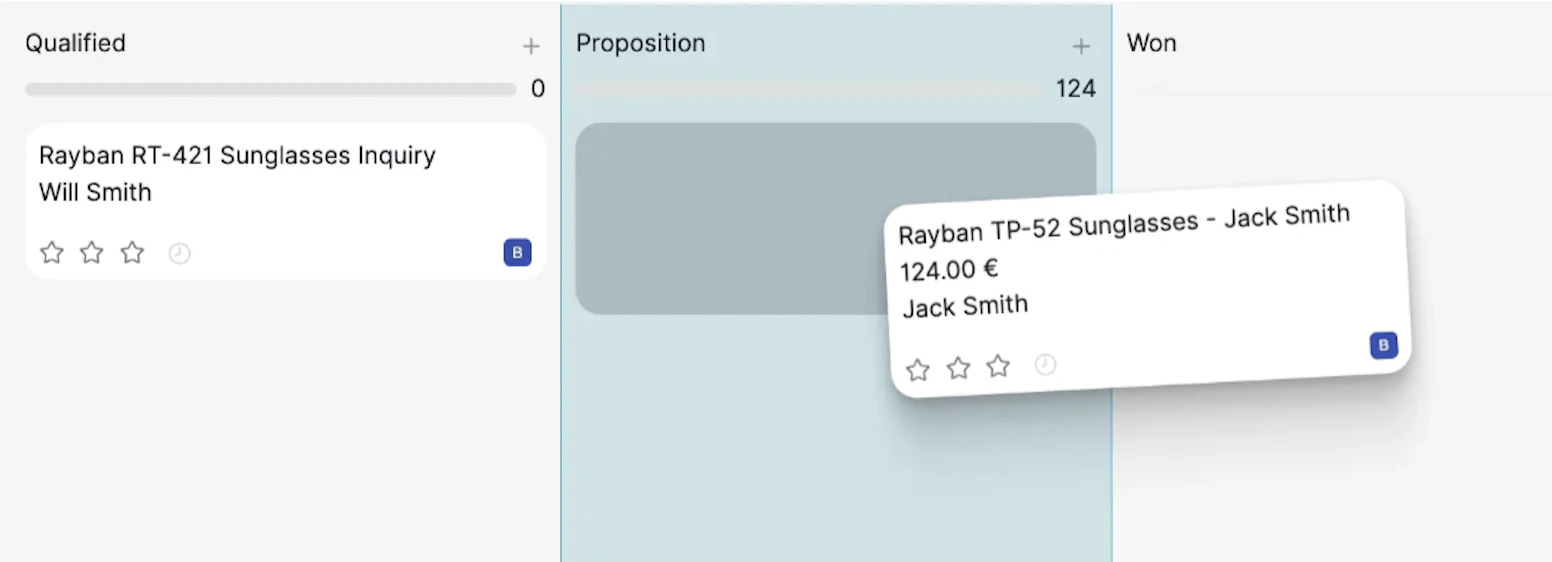
Closing the Deal
Marking as Won
Marking as Lost
If a deal doesn’t work out, click the Lost button. A dialog appears where you can select a Lost Reason from the dropdown and add a Closing Note describing what went wrong. Click Mark as Lost to archive the opportunity. This data helps you analyze why deals are lost and improve your approach over time.Importing Records
Reporting & Lead Analytics
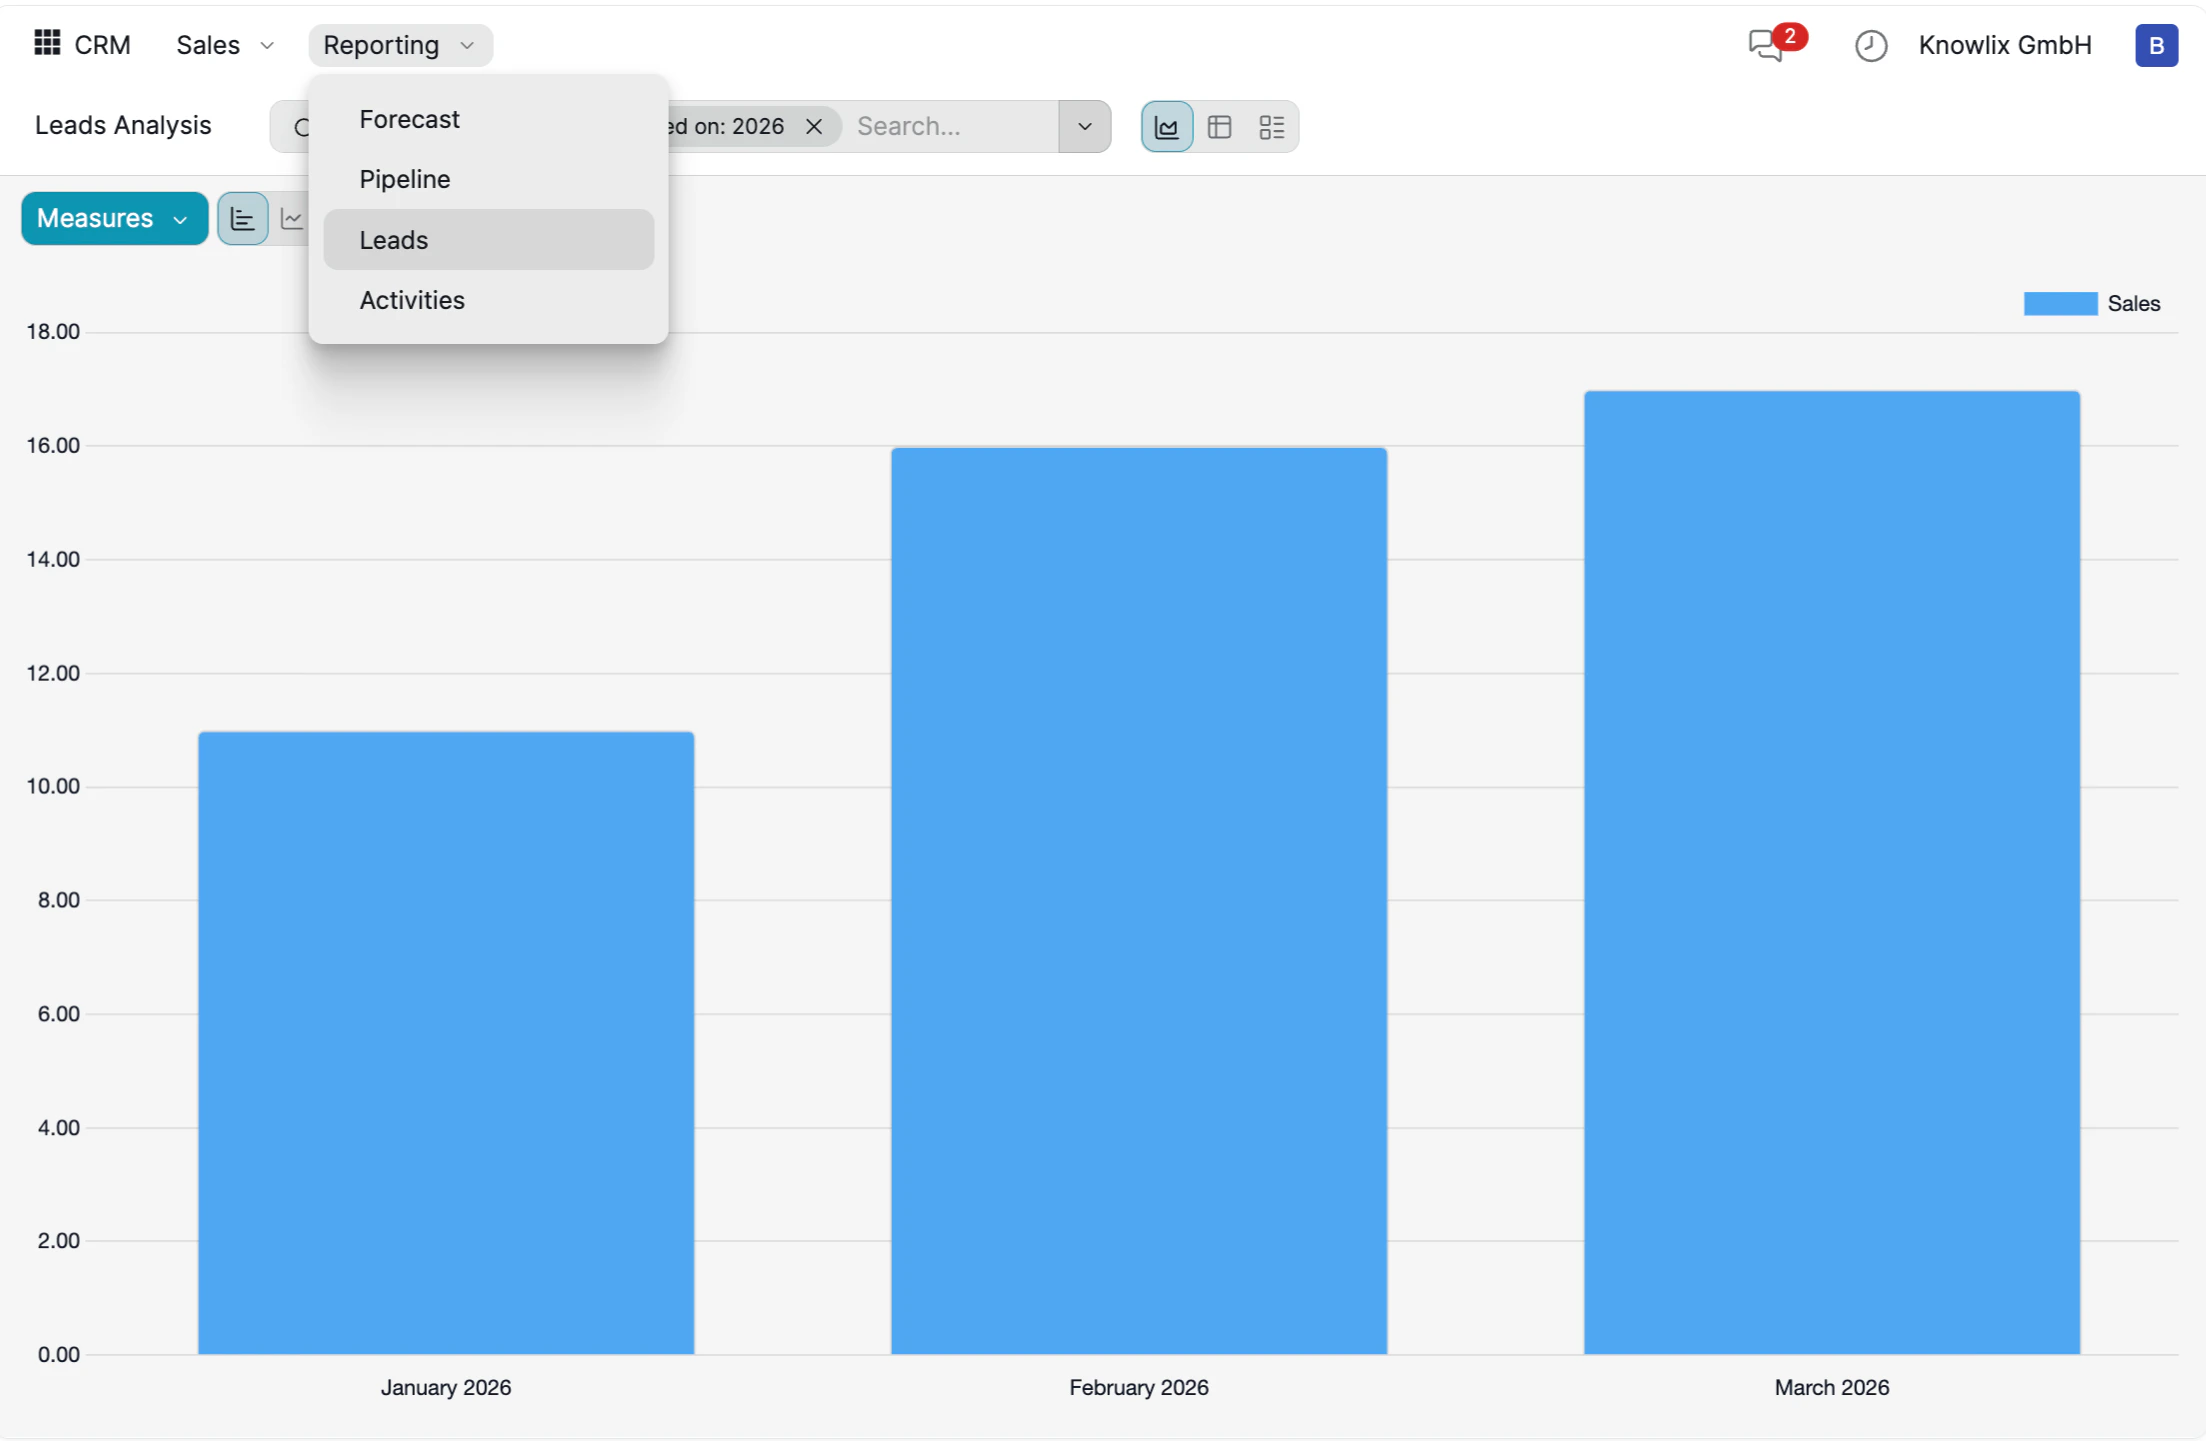
- Forecast: Projected revenue based on pipeline stage and probability.
- Pipeline: Distribution of deals across stages.
- Leads: Total number of leads created over time.
- Activities: Follow-up actions like calls, emails, and meetings.
Customizing Your Workspace
- Flexible Layouts: Switch between a visual Kanban (Grid) pipeline and a detailed List View to see more data at once.
- Powerful Filtering: Use the filter menu to drill down into My Pipeline, Unassigned leads, or Open Opportunities.
- Advanced Grouping: Group your deals by Salesperson, Sales Team, City, Country, Lost Reason, Campaign, Medium, or Source to analyze where your best business is coming from.
- Communication Shortcuts: In List View, you can trigger Email or SMS follow-ups directly from the dashboard without opening each lead.
More Information
CRM
Customer relationship management and sales pipeline
Contacts
Centralized contact management for customers and partners
Stages
Workflow stages for pipelines and kanban boards
Members
Membership plans and subscriber management
Subscriptions
Recurring subscription and billing management
Recruitment
Job postings, applications, and hiring pipeline
Helpdesk
Customer support tickets and SLA management
Frontdesk
Visitor check-in and front desk management
Referrals
Employee referral program management
Pro Tips: Sales
AI assistant tips for the Sales module